


Lessons from Barcelona (drafting?)
It's packed, so act like it
As much as the myth of an ironman is about being an individual event against yourself, it is far from being individual and straying further from it years after years. Don't get me wrong, it does push yourself mentally and physically to your limits and will be mostly determined individually. The large majority also plays fair in the drafting game and tries to respect the rules given the conditions. The amount and density of top athletes racing these days simply means that given the conditions sometimes takes more importance than the respect the rules part. And this can only be more true for pros or top age-groupers that fight for places and qualifying spots instead of time. The most hilarious part spectators don't even realize? 'The winner rode on its own, at least!' Yeah, drafting a few meters behind these media motorbikes (and remember, the rule in this case is 35m behind a vehicle, not the usual 12m).
Anyway, you can complain and complain, it's a never-ending debate. In the end, you have to fight it, registering only for races with less density or tougher courses for instance, or accept it and try to play smart. When we registered for Barcelona, we knew what we got ourselves into. A completely flat bike course with a record of 81 male pros registered, all not too far from each others as the top ones are busy with Kona. The smart in there basically boils down to, swim fast because you can, bike not too hard staying with a group if you can but do not overdo it, and hope you can run like crazy after that. I'm talking sub-3 marathon; we wanted it a few times, but we were never quite there actually. Only a controlled bike can lead to this (and it did as Jean-Claude already wrote).
My goal going in was setting that PB (<8h50), and a clear one if possible. 8h45 was the mark I fixed myself, with a stretch if everything is fine just below 8h40. I honestly did not expect sub-8h30 and didn't realize I was racing for it until 30k of the marathon when mum told me I could do it. Naturally, it got me thinking in the following days, what made it possible? A great shape and race for sure. Nevertheless, I think the fact that I rode a group had also an impact (for the clarification: from km 60 to 170, with sometimes more 8-10m than the 12m required, always with a referee motorbike though). With Jean-Claude having already related the race itself, I thought I would use the downtime of off-season to run the numbers and write some code to play with all the data I have recorded from power-meter and GPS. So bare with me, and enjoy the ride (you can draft me here)!
Virtual elevation, or when flat may not be flat
Power estimation formula
OK, this section might be a bit more mathematical and technical (ie skip it if you want). It is just to show you where the numbers and graphs come from and how much confidence you can put into the data. I will try to simplify it here.
Our goal in the end is to quantify how hard or easy the bike was in Barcelona and for this we have at disposition the GPS data from my Edge 520 and the watts measurements from the Powertap P1 pedals. Let's dive directly in the power formula (see https://3record.de/about/power_estimation#bike):
P = (C_aero + C_rolling + C_slope + C_kinetic) * v
with P the power (in W, watts), v the speed (m/s) and different contributions (∝ = proportional to):
- C_aero: fighting the apparent wind (your speed plus any head wind) with a given frontal area, C_aero ∝ CdA * (v+v_wind)^2
- C_rolling: tires having some rolling resistance and being compressed by your mass, C_rolling ∝ C_rr * m
- C_slope: climbs, or you bringing your mass on top of height differences, C_slope ∝ m * h
- C_kinetic: accelerations or differences in speed, C_kinetic ∝ (v^2-v_init^2)/d
Bringing it all together, we get an equation quantifying our aerodynamic CdA based on data from GPS or pedals with just two additional unknowns (wind speed and rolling resistance):
P = (X_areo * CdA * (v+v_wind)^2 + X_rolling * C_rr + X_slope * h + X_kinetic * (v^2-v_init^2)/d) * v
Of course, having data recorded each seconds, we could try to solve for CdA (which might often change due to position on the bike or presence of a group or not) setting a constant C_rr and wind direction+speed. The variations of the data makes it quite difficult however to extract anything but noise from this.
Virtual elevation
The trick here is to rewrite the equation for h, the elevation difference, and solve it on larger intervals than the record interval of 1s. For all references, the idea comes from GoldenCheetah's Aerolab/Virtual elevation. While it was first devised to ride loops and optimize until the virtual elevation is null, comparing it to GPS data also works quite well. The main advantages is that GPS errors on each seconds generally cancel out in the elevation as you will use the cummulated elevation difference from the start to the end of your solving interval. As such, you end up with a matrix equation:
h = A * (Cda, Crr, 1)'
The visual representation for the bike in Barcelona is the following (see CdA analysis on 3record, Activity analysis on 3record for the raw data) which is solved by default for the full duration but can be solved on shorter intervals by zooming the plot:
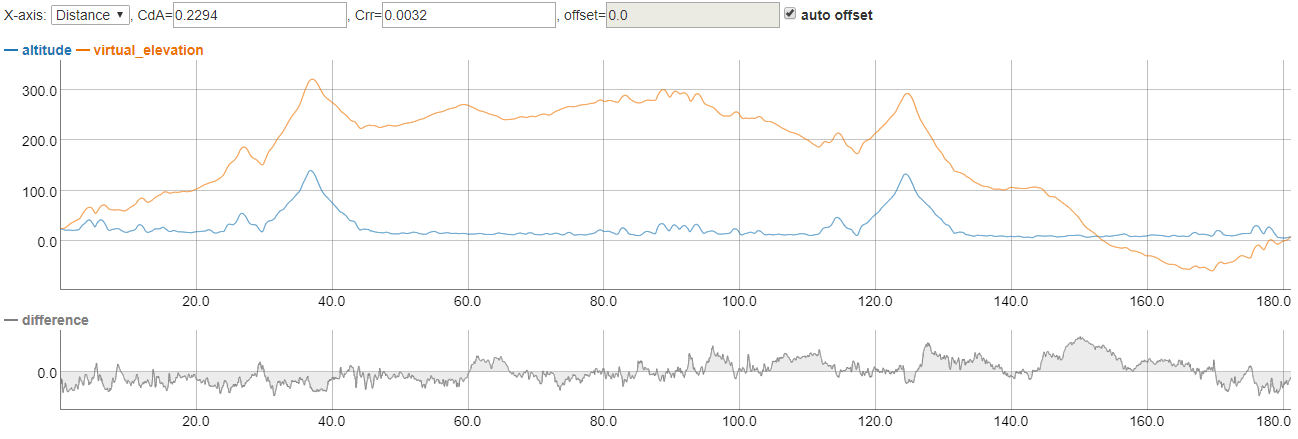
Virtual elevation plot for my bike at IM Barcelona 2018.
Note that we made here the assumption of no wind, which might introduce some errors, When the difference on the bottom subplot is negative (orange curve drifts high compared to the real GPS elevation), it means that the aero was actually worse than what is presented on the boxes above (head wind, bad position, etc). On the contrary, a positive difference (orange curve goes down) means a better aero than expected (tail wind, good position, drafting, etc).
You can already guess from there that my second lap has been better than the first one (orange curve first goes up then down). I think we're therefore ready for some aggregated data.
180k worth of plots
To understand them correctly, here is the short bike report. First 55k on my own, where I realize at the U-turn that I will be soon overtaken by a big group. time to eat and prepare to catch the train. Effort is relatively constant and feels easier on the way back (until 90k). The larger the group becomes, the more irregular it is. Overtaking amateurs in their first lap also makes it worse and worse. Finally, in the last 10k, the group explodes and I take the lead of those who did not break in front.
OK ready. Gimme the plot!
First, what you would see if you were simply looking at the tracker and taking the time. A constant speed slightly above 39km/h average (around 40km/h without th first 3 and last 3 kilometers with lots of bumps and aerobars interdiction). All the plots below have a smoothing over 120 points, or 2 minutes, for better visualization.
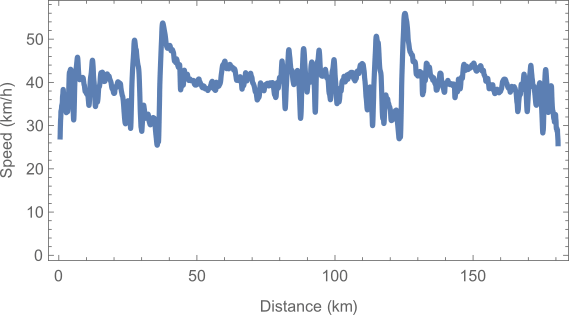
Speed.
Now some people might stop there. Perfectly paced 180k, somewhat faster than Zürich, but not too much considering the easier course. A good decision nevertheless, as it would allow for a very fast marathon. The whole point of this exercise however is to say, it did not feel that hard or that constant. So let's look at power next (I must say for full disclosure that I have the impression the pedals had some drops during the race with watts being shown as only half during one-two seconds before coming back to normal, probably the right pedal wireless connection not performing that well).
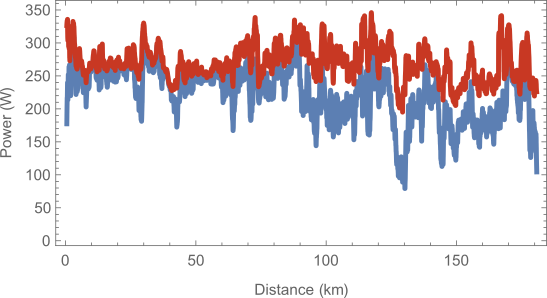
Power (NP=Normalized Power in red, AvgP=Average power in blue).
Anyway, it is clear from the plot that I ride a 250-255W normalized ("equivalent constant effort", average of the fourth power of the watts over 30s which is supposed to account for intervals or non-constant efforts) and only very slightly lower this when riding the pack. The average power is however another story. In the first 80k, I am basically riding my own pace with average power being almost equal to normalized power. The effort is constant (note: voluntarily lower than in Zürich where it was around 250W average during the first 100k but 275W normalized, the climbs explaining the differences there). After that, I am stuck in the group, and having to follow the pace, I sometimes push more, sometimes less, quite often also not pedaling to keep the required distance to the athlete in front of me or dropping behind when someone overtakes me. You can clearly see this in the VI(Variability Index=normalized watts/average watts) plot. VI=1.0 would be a perfect constant effort, and I'm not too far from it in the first half. VI=2.0 is way too much for any ironman textbook... do they target pro packs though?
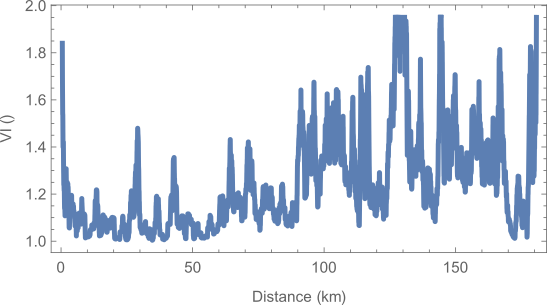
VI=Variability Index=NP/AvgP.
The same information can also be seen in the amount of time spent pedaling. In a constant effort, you are always pedaling except for turns or intersections. In the group, I always had to stop pedaling to keep myself from getting a penalty. Notably, I gave a big push at the beginning of the descent but hardly pedaled for the rest of it in the second loop (large drop around km 130).
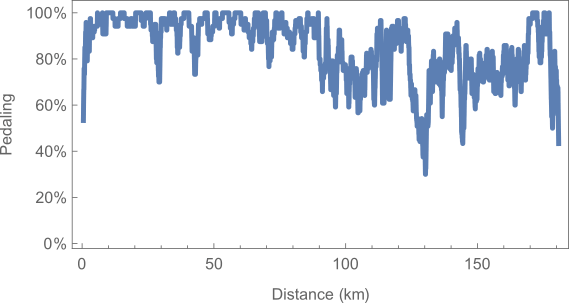
Percentage of the time spent pedaling.
And to conclude, the CdA. Around 0.23 for the total ride, it is sensibly better than my usual (more in the 0.27-0.29 range). Riding alone I was actually just like normal, a bit higher at the beginning (maybe 0.3) then around 0.27. Only with the group coming and getting bigger and bigger did it get always better. The more irregular it became, the more I tried to take concentrate on nutrition and on stay aero, and it clearly shows in the plot. Only in the last kilometers did I push again a bit more, and got out of the aerobars for the small climbs to stretch my back and get ready for the marathon.
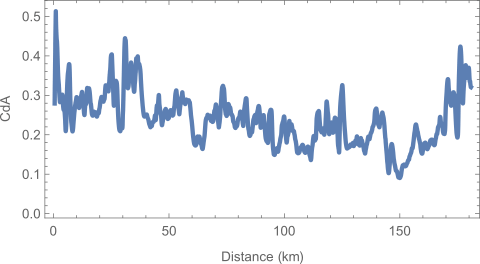
CdA.
Conclusion
Alright, believe it or not, this took me quite some time to put it all together, yet I am still not 100% sure what to take out of it. But here are a few points:
- Riding 250W instead of 270-275W in Zürich made a huge difference in the perceived effort. Probably, we should learn to be more constant in the effort even when the course is not flat.
- (Kinda-)Legally-drafting at 10m is around 10% saved watts thanks to improved CdA.
- Too big pelotons suck. Riding is irregular with no gained advantage in comparison to riding to 5 or less. My supposition is that if the group would have been smaller, the first one on the front would have been more motivated to push a bit more in average with the same normalized power, and the final time would have gotten even better.
- Waiting and staying with a group is much easier, if only mentally. I was in a waiting-the-marathon mode instead of a racing mode, and it means it felt much easier to follow the nutrition plan and not get bored on the bars. If ever stuck in a group, take it easy and trust your run.
- My personal goals in ironman have gone from sub-9h to sub-8h40 (to managing sub-8h30 before it was actually planned). Now I have been twice in the top-15 pro and with a single minute faster I could have been 11th in Barcelona. Nonetheless, I have to get better on the bike and ride ahead of such a pack if I ever want a top-10 or top-8 to be called on stage the following day.
The goal for next year is not yet clearly defined, and might actually be quite different than sub-8h30 in terms of time. I think it is always difficult to compare raw times in ironman and PBs do not mean as much as in marathon or running in general. Barcelona remains a great experience though with a lot of confidence gained and lessons learned. For now, having fun riding, running, swimming, and training will be enough!
Enjoy the ride!
A few thoughts below:
1) I guess that you have to mention a few calculations assumptions:
- No tire deflation over the 180km (would increase C_rolling)
- Stable ambiant conditions (pressure, temperature and humidity all affect several power components)
- No transmission frictions (would add another power component)
Anyway, with these limitations in mind (of limited effect), your calculations still remain largely valuable and interesting, leading to the other points... :)
2) Regarding the effect of pack riding on variability index, a first logical conclusion for race training is to include more interval training. As always, the need is to prepare the body to manage race conditions, here being a highly variable power with 350-400W bursts intersped by 0-100W periods. This is generally not the way long distance triathletes train...
3) Still regarding power variability, its intermittence will also have other effects, for instance regarding race nutrition. The stress response caused by high intensity bursts will lower digestive ability, necessitating as well a non-linear nutrition plan. What about ingesting more energy in the first, non-packed part than in the second? What about varying food texture as well (f.eg. bars and gels first, liquids second)? I would, however, keep fluid intake broadly constant since water absorption is less affected by blood dynamics than energy (carbohydrate), which leads to interesting osmolarity issues...
4) I definitely agree with your conclusion "probably, we should learn to be more constant in the effort even when the course is not flat" that can be related to your other points regarding perceived exhaustion (be it pack riding, etc.). My comment here is related to carbohydrate oxidation which is exponential: A power increase of 10% will translate into a far higher increase in carbohydrate oxidation... In other words, a perfectly linear power will spare more glycogen and, since muscle glycogen levels are related to perceived exhaustion, will be mentally easier to sustain...
Not only explaining the pain difference between 250W and 270W, this point can also be related to pack riding: As there is a few (tens of) seconds lag between the actual power and its perception, this lag may, when repeated hundreds of time, cause an extra glycogen oxidation that would be best spared. Here you are lucky enough to have your bicycle powermeter, so believe it and try to smooth power transitions as long as you can when in packs (i.e. not allowing another rider to close the gap).
5) Beyond tactical considerations, the main physiological drawback to adopt a perfectly linear cycling power pace is regarding cycling efficiency. For instance, managing a constant 250W on a downhill is difficult, if not impossible due to the required cadence that deteriorates cycling efficiency (i.e. the mechanical to metabolic power ratio). So, another tip here may be to train for various cadences, to allow for a greater ability to truly normalize your power (and smooth transitions).
Hoping that these few additional thoughts may be of some help, feel free to also comment and, again, thanks for your great analysis! :)
par Robin the 21-10-2018 at 12:26
Thank you for your comments, very interesting from you just like I still remember your nutritional advice in Zürich last year regarding our handling of Frankfurt.
1) sure, lots of assumptions. Actually we have an efficiency factor in our model if you look at the link to 3record. But anyway, I would say this analysis is limited by data accuracy and wind being unknown. Some aerobar pods with sensors are coming to the market and might help fix this.
2) I actually like that better than the boring constant 5h effort ;-)
It's just not the most efficient.
3) interesting. I sure had a lot more focus on staying aero and following my nutrition plan than during the previous ironmen. However I certainly realized that pace does have an influence on what I can ingest and my willingness to eat.
4-5) Yes, some variability due to profile is acceptable but we have a lot more than other pros and probably too much. We should push a lot less in the climbs and a little more on the flat or descents, and we would probably end up being faster for less stress on the body.
par Daniel the 21-10-2018 at 17:21
4-5) Regarding pacing, you have a few websites that may help:
a. To define an appropriate power on a known cycling course
http://www.cyclingpowerlab.com/timetrialpacingstrategy.aspx
b. To define the power goal considering your FTP/lab testing
https://wpassets.trainingpeaks.com/wp-content/uploads/2017/01/howtocheatusingpowermeterinironman-2.png
c. I also looked on research papers and, while many emphasize the importance of pacing on performance, I found none that specifically focused on male pros riding as packs during long distance triathlons. A few of interest still:
-Bike and run on downhill segments predict long distance triathlon performance: https://www.ncbi.nlm.nih.gov/pubmed/24405984
-Pacing strategy of a winning female pro: https://www.ncbi.nlm.nih.gov/pubmed/30161089
However, I agree that the case of a female cannot be applied to males due to far less athlete density. Then, the specificity of pack riding seems to have not been studied so far.
par Robin the 22-10-2018 at 11:45